Multimodal Trajectory Planning for Surface Vehicles Supplementary video results
Supplementary material for a manuscript under review
This page hosts three schematic animations of the method, followed by the closed-loop
simulation videos that accompany the results section. For the full method, please refer to the submitted
manuscript.
Three schematic animations of the method
Each clip isolates one idea: a barrier that commits an avoidance side, an enumeration of
all side combinations, and a parallel batch that solves them at once.
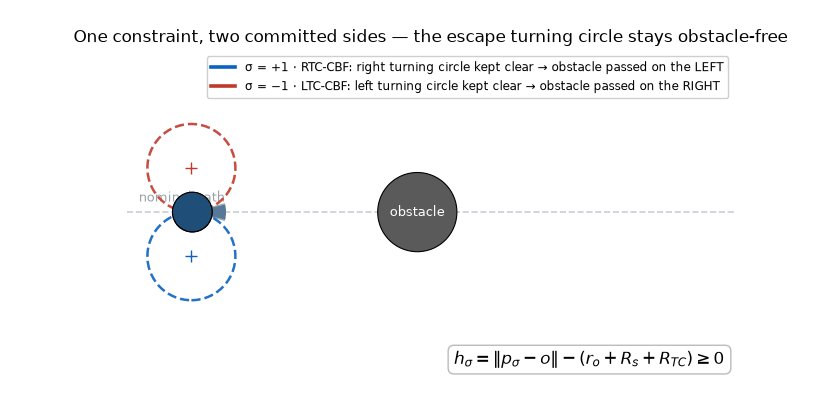
1 · One constraint, two committed sides: LTC-CBF and RTC-CBF
The turning-circle CBF keeps the escape turning circle on the committed side clear of the
obstacle. A single discrete parameter σ selects the right circle (RTC, σ = +1) or the left
circle (LTC, σ = −1); flipping it mirrors the maneuver, and both sides rejoin the nominal
path after the pass.
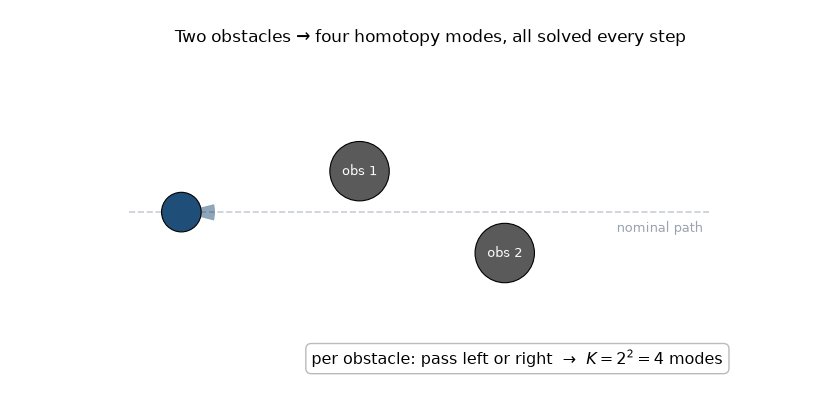
2 · Two obstacles → four modes
Each obstacle can be passed left or right, giving K = 2² = 4 topologies
(L·L, L·R, R·L, R·R). A gradient planner is trapped in its starting class;
the multimodal planner solves all four at every step and commits by cost. For N branching obstacles
this is K = 2N; the ship results below use N = 4, K = 16.
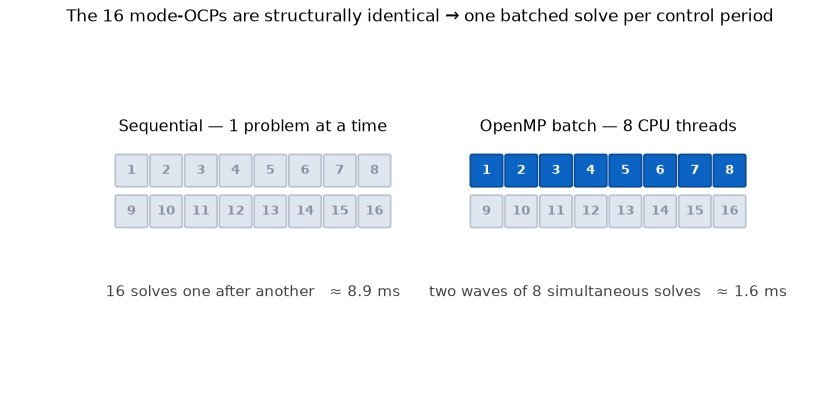
3 · All modes at once: one OpenMP batch
The K mode-problems differ only in their σ vector, so they share dimensions and
solver structure and can be batched. An OpenMP-parallelized batch (acados/HPIPM) solves them
simultaneously and commits the arg-min mode. At K = 16 this is 1.4 ms batched versus
8.2 ms sequential, well inside the 1 s replanning budget.
Schematics loop; the closed-loop clips below play once.
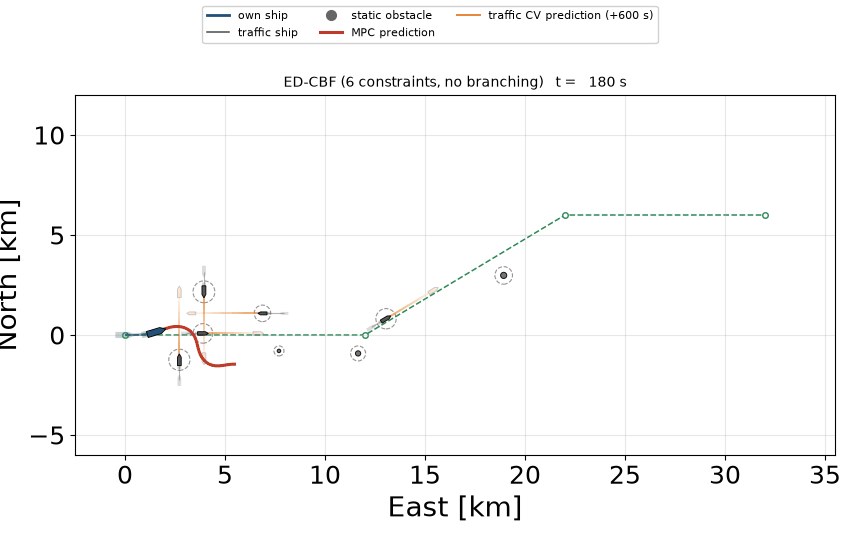
Three planners, identical traffic, three densities
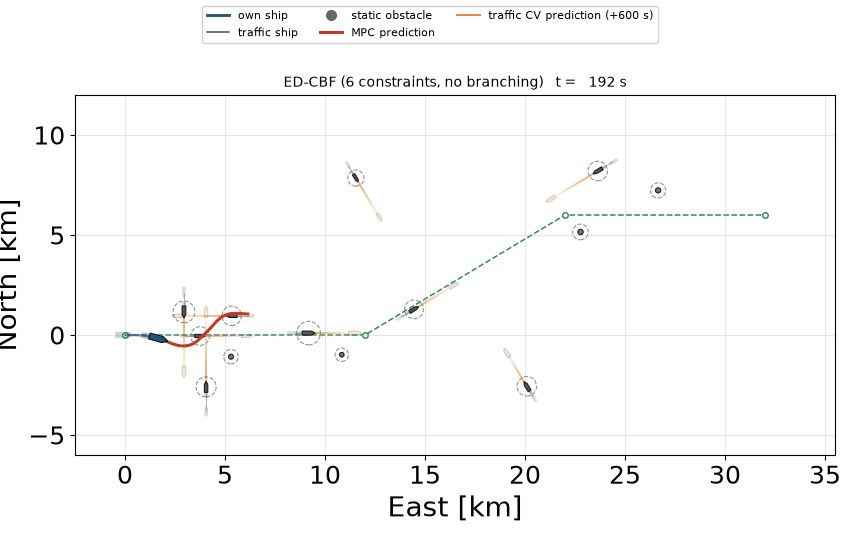
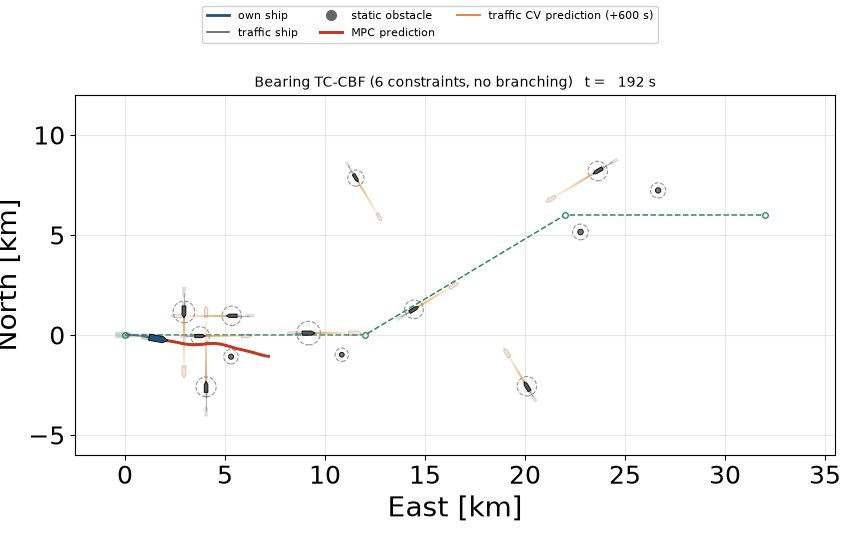
Each row is one paired realization of the benchmark. All three planners face
byte-identical traffic and perceive the same six nearest ships; the compared configurations differ only in
how the avoidance side of each ship is determined.
Density 1 — 8 dynamic + 3 static obstacles
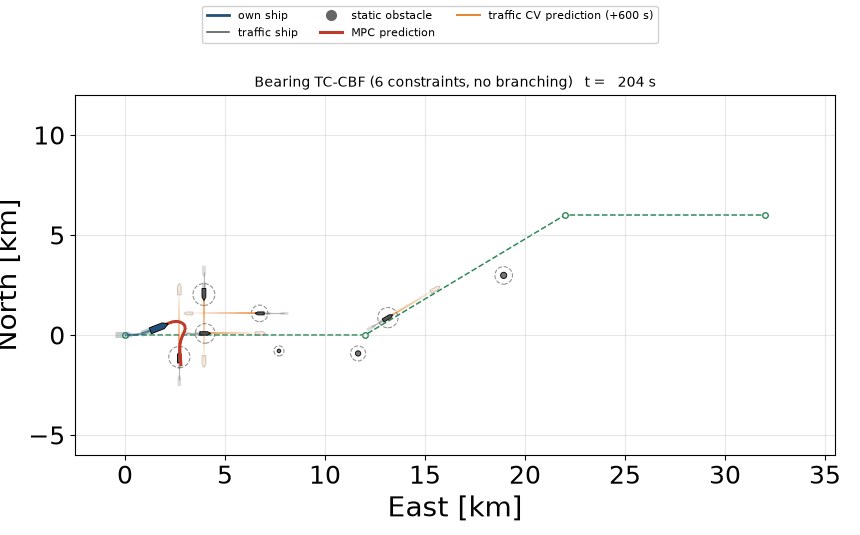
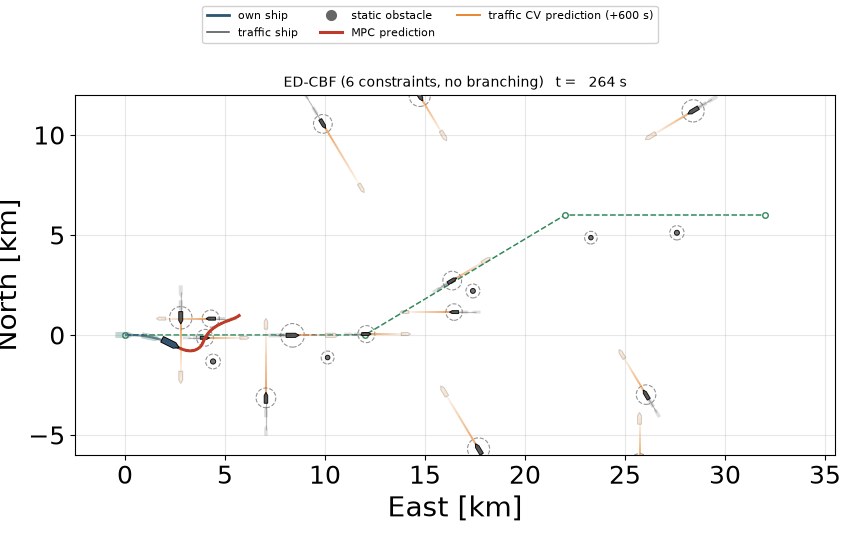
Baseline A — safety-zone breach at t = 297 s
Distance-based avoidance with no committed passing side. Stopped by the opening encounter group.
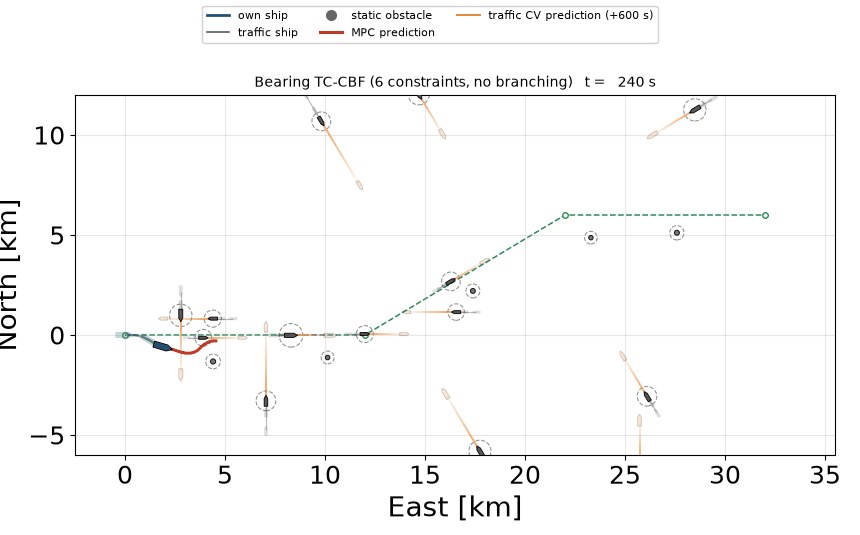
Baseline B — safety-zone breach at t = 341 s
Single committed passing side per ship. The commitment is invalidated and no alternative
remains.
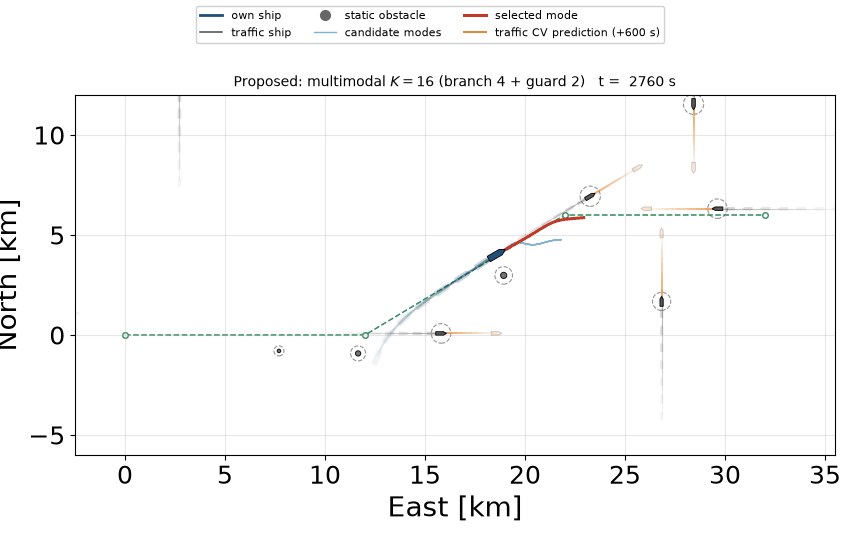
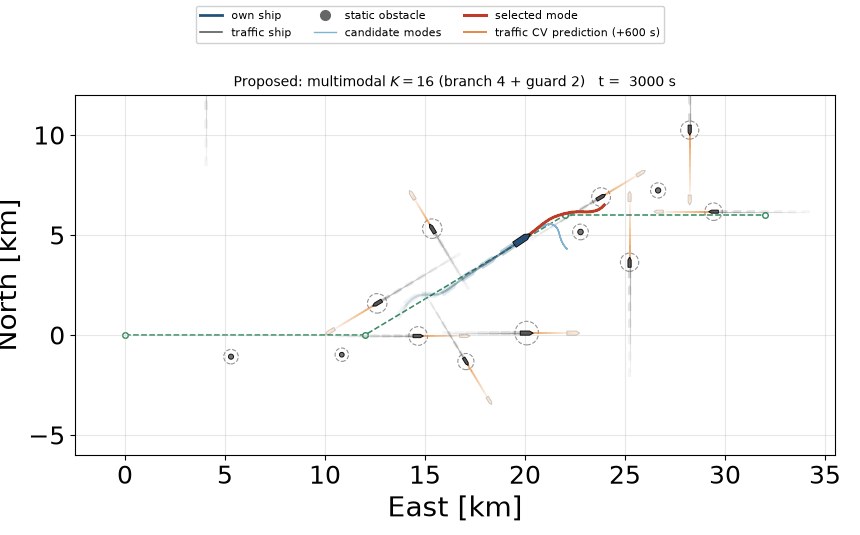
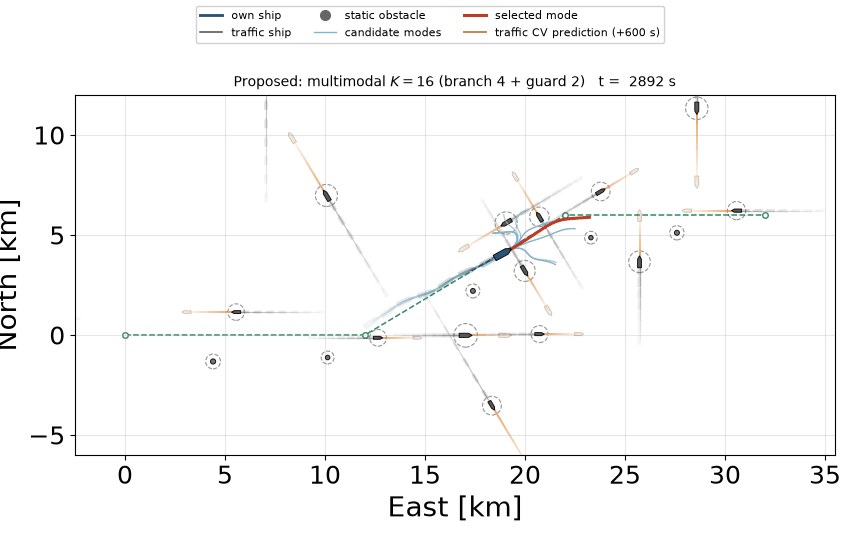
Proposed — completes the route
Clears the same group and finishes in 4607 s, changing its committed avoidance route 8 times.
Worst-case clearance 60 m beyond the combined safety radius.
Density 2 — 12 dynamic + 4 static obstacles
Baseline A — safety-zone breach at t = 327 s
Same failure mode, one density level up.
Baseline B — safety-zone breach at t = 315 s
The prescribed side reverses as a ship crosses the bow line.
Proposed — completes the route
Finishes in 4996 s, changing its committed avoidance route 17 times. Worst-case clearance 82 m.
Density 3 — 16 dynamic + 5 static obstacles
Baseline A — safety-zone breach at t = 437 s
Densest level. The opening group is not resolvable without a committed side.
Baseline B — safety-zone breach at t = 406 s
A single committed side is not enough when several ships are decision-relevant at once.
Proposed — completes the route
Finishes in 4814 s under sustained congestion, changing its committed avoidance route 26 times.
Worst-case clearance 92 m.
Clips start automatically as they scroll into view.
Aggregate outcome of the benchmark
The clips above are single realizations. For context, the paired Monte Carlo statistics
reported in the manuscript are reproduced below, over 100 trials per cell.
Success / safety-violation rates in %, and the median depth by which a violating trial penetrates
the safety zone. The remainder of each cell are timeouts.
Configuration
Density 1
Density 2
Density 3
suc./viol.
depth [m]
suc./viol.
depth [m]
suc./viol.
depth [m]
Baseline A
40 / 60
250
31 / 69
229
20 / 80
266
Baseline B
76 / 24
608
77 / 23
646
65 / 31
598
Proposed
99 / 1
219
97 / 3
127
86 / 10
19
A breach is an infringement of a virtual keep-out disk of roughly one kilometre, not a hull
contact, so each trial is simulated to the end of the route even after the zone is first entered. That leaves
the success statistics unchanged and additionally records how far each configuration cuts into the zone.